Why We Must Raise Taxes on the Rich

So you don't understand GDP? Hardly surprising.

Here you go: http://www.investorwords.com/2153/GDP.html. No need to thank me.

I noted that you don't address the fact that our taxes are currently lower than they've been at any time since 1950. Care to dispute that?

How did you arrive at the conclusion that the US is "the greatest liberating force ever known to mankind" Certainly not by "comparing ourselves with other countries around the world"?

Oh, I understand GDP, I don't understand what GDP has to do with how much our government is overspending or what percentage of tax we pay. Can you explain the correlation? And while you're at it, can you even explain the difference between GDP and GNP? (I don't want a link, I want YOUR explanation.)
 
Nice little shell game you've come up with, but it Epically FAILS.

You can't judge taxation based on GDP, most people don't even understand GDP. You can make a really neat (but irrelevant) chart, and it looks like Americans are getting off easy on taxes... but your chart fails to recognize our GDP is mammoth compared to most other countries. In fact, I am kinda surprised we aren't at the very bottom of the list, if that is the criteria you are using.

AND When the hell did this mindset develop, that we must constantly be comparing ourselves with other countries around the world? I don't give a shit how much tax someone pays in Venezuela! It makes NO difference to me, and it makes NO difference to my country! I don't care that America is not like France! I don't want to be like France! This is the United States of America, founded on principles of freedom and liberty for all, and the greatest liberating force ever known to mankind.

junior_samples-dunce.jpg
 
Oh, I understand GDP, I don't understand what GDP has to do with how much our government is overspending or what percentage of tax we pay. Can you explain the correlation? And while you're at it, can you even explain the difference between GDP and GNP? (I don't want a link, I want YOUR explanation.)


Curiously, EpicFailure didn't bother to respond to my question or even acknowledge it........... hmmmm?
 
Curiously, EpicFailure didn't bother to respond to my question or even acknowledge it........... hmmmm?

Poor Dixie Dunce.

Can't explain why "you can't judge taxation based on GDP".

Obvious-Retard-is-Obvious.jpg


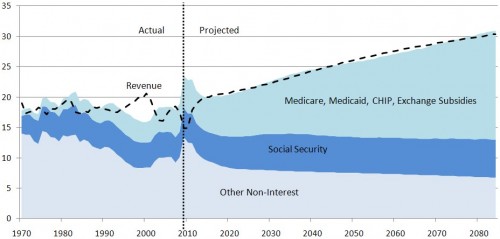
Anybody wit a box of crayons can make a chart to show how everything is going to be just fine. I'm not sure what this was supposed to prove, hell, I can't even figure out what it's showing me! Here's a stat for ya though.... Our INTEREST on our debt (not the debt itself) will cost us more per year, than ALL military expenditures combined by 2016. The deficit for this year alone, is more than the total cost of the Iraq and Afghanistan wars combined. If our debt continues to grow at present rates, our children will have to pay 75% tax on each dollar made, to pay the interest on the debt.

Now you can run around with your little charts, crowing about how there is no problem here... but there is indeed a problem, and only someone who is completely ignorant of the facts, would even attempt to argue otherwise.


The chart isn't all that complex. It's a chart of projected spending and revenue from now until 2080 (roughly).

And I didn't say that there was no problem, I just pointed out that the problem is not that current law would put us on a disastrous track.
 
The chart isn't all that complex. It's a chart of projected spending and revenue from now until 2080 (roughly).

And I didn't say that there was no problem, I just pointed out that the problem is not that current law would put us on a disastrous track.


Oh, it's very pretty Nigey, did you use tempra paints? It almost looks like a butterfly, I noticed that first.. so I am sure it shows us everything is going to be just fine and dandy... we will all have happiness and butterflies if we just ignore this talk of cutting spending and national debt, and just keep pouring more money in through higher taxes on the rich and the greedy corporations..... yeah, I totally get what your cute little picture is supposed to be telling us, very creative. Now, it is time for your Jello cup and a nap!
 
Oh, it's very pretty Nigey, did you use tempra paints? It almost looks like a butterfly, I noticed that first.. so I am sure it shows us everything is going to be just fine and dandy... we will all have happiness and butterflies if we just ignore this talk of cutting spending and national debt, and just keep pouring more money in through higher taxes on the rich and the greedy corporations..... yeah, I totally get what your cute little picture is supposed to be telling us, very creative. Now, it is time for your Jello cup and a nap!


I don't work at the CBO.
 
The chart isn't all that complex. It's a chart of projected spending and revenue from now until 2080 (roughly).

And I didn't say that there was no problem, I just pointed out that the problem is not that current law would put us on a disastrous track.

Whose chart is that? Link?
 
I don't work at the CBO.

Well then, your chart is misleading, because the CBO only projects 10 years out on anything, and that is solely based on current economic trends. What some very clever pinhead has done, is taken the CBO projection (a guess) and extended it on out to 2080. So it becomes an exponential guess.

Nigey, I think it is a brilliant design myself, it has that artistic abstract to it that everyone loves to see... Personally, I would have used more reds... since the subject is the $13 trillion national debt, but it is obvious your liberal influence trends toward blues..


Here's a link to the CBO document:

http://www.cbo.gov/ftpdocs/115xx/doc11579/06-30-LTBO.pdf


Scroll down to page 68, Figure A-1.
 
Poor Dixie Dunce.

Can't explain why "you can't judge taxation based on GDP".


“Amid complaints about high taxes and calls for a smaller government, Americans paid their lowest level of taxes last year since Harry Truman's presidency, a USA TODAY analysis of federal data found.


Some conservative political movements such as the "Tea Party" have criticized federal spending as being out of control. While spending is up, taxes have fallen to exceptionally low levels.


Federal, state and local income taxes consumed 9.2% of all personal income in 2009, the lowest rate since 1950, the Bureau of Economic Analysis reports. That rate is far below the historic average of 12% for the last half-century. The overall tax burden hit bottom in December at 8.8.% of income before rising slightly in the first three months of 2010.”


http://www.usatoday.com/money/perfi/taxes/2010-05-10-taxes_N.htm


“…as a share of the nation’s economy, Uncle Sam’s take this year will be the lowest since 1950, when the Korean War was just getting under way.

And for the third straight year, American families and businesses will pay less in federal taxes than they did under former President George W. Bush, thanks to a weak economy and a growing number of tax breaks for the wealthy and poor alike.

Income tax payments this year will be nearly 13 percent lower than they were in 2008, the last full year of the Bush presidency. Corporate taxes will be lower by a third, according to projections by the nonpartisan Congressional Budget Office.”


http://www.bradenton.com/2011/02/08/2938480/numbers-show-us-taxes-lowest-since.html#ixzz1JFc6nwBr


captain-moron.jpg

 
Corporate Tax Cheats are Bankrupting America!

Posted on Thu Apr 7th 2011, 5:37am By UTC

Here's a handy infographic that ties specific corporate tax cheats to specific cuts that affect all of us. If these corporations paid their fair share, we could uncut these budgets.

infographic-corporate-tax-cheats-pay-up.jpg
 
Spending is obviously "way up," as the deficit for February was greater than the entire year of 2007. Taxes haven't been cut since 2003, although the 2001 cuts were extended. Those cuts were not large, as they only lowered the rates from the 90s by small portions.
 
Here's a link to the CBO document:

http://www.cbo.gov/ftpdocs/115xx/doc11579/06-30-LTBO.pdf


Scroll down to page 68, Figure A-1.

First, thanks for the link and direction to the correct page. I appreciate that.

Second, LMAO.... so, historically revenue has been between 14.8-20.6% of GDP with an average of 18%. Yet, their 'baseline' scenario has revenue increasing beyond 20% around 2020 and continuing to increase through 2080, never going below the HIGH end of the last 40 years range? Even their 'alternative scenario' located on the same page uses an average rate of 19%.... which is still above the long term average, but at least that is close to it.

Bottom line, that 'baseline' scenario is only achieved if you MAKE the changes we are talking about. If you note, on page 46 it states that the only way that scenario is viable is if their are revenue increases much larger than the average (tax increases the most likely way to achieve this) or substantial cuts in spending (or a combo of the two).

So no, the 'do nothing' as you claimed is a LIE. YOU LIAR!!!
 
Posted on Thu Apr 7th 2011, 5:37am By UTC

Here's a handy infographic that ties specific corporate tax cheats to specific cuts that affect all of us. If these corporations paid their fair share, we could uncut these budgets.

infographic-corporate-tax-cheats-pay-up.jpg

The ignorance of the above chart is astounding. Tell you what Ken, why don't you share with us WHO it is that pays corporate income taxes. This should be quite amusing.
 
Back
Top