Airstrip One
Completely Effed
Should I be?

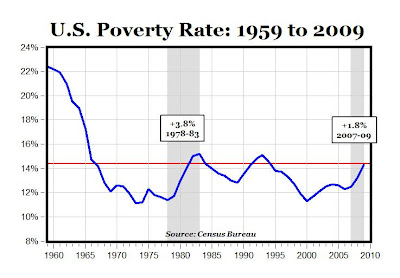
http://mjperry.blogspot.com/2010/09/us-poverty-rate-1959-to-2009.html
So, in other words, we have spent how much money and not seen ANY reduction in the poverty rate?
Thanks for the PROOF...
During the Shriver years more Americans got out of poverty than during any similar time in our history. (The Clinton years - employing the same philosophy - were the second best.)
LMAO.... try learning to read a chart moron. The poverty rate was plunging long before Johnson ever started the war on poverty. The poverty rate then stuck between 12-14%, spiking with each recession the country went through. As the economy improved after each recession, the poverty rate also improved as it naturally would. Johnson's programs have done NOTHING to reduce the poverty rate in this country moron. Take a look at that chart again.... the poverty rate at the end of 2009 is right where it was when Johnson's war on poverty began.
Very true. That's what I'm getting at. They have for so many years touted themselves as the champion of the poor, the minority, they downtrodden, but their policies have done nothing but put salt in the wound. They have touted gay rights at the expense of the moral fiber of this nation,
have touted free speech for all at the expense of our morals and values,
give money like it's going out of style but want to tax everyone to death (and in death),
and, while they say the Repubs love the rich people, the rich is all the Dems pander to for their campaign funds.
I was raised in a middle class Democrat home. I wised up when I went to college, and I see why my family was stuck where it was. My grandmother worked her butt off, but my mom was dependent on the government for nearly everything (I remember government cheese lol). I wised up and got several degrees, spent some time in the US Army as an artillery officer,
and now work my butt off to feed my family. The degrees help, but one must make a difference on his or her own, not by allowing the government to foot their bills. The Dems have put an entitlement attitude into the minds of so many people; they've created a monster, one I don't see going away for some time.
I guess chart reading is not something you were taught...I will give you a 'hint'...work from left to right. A downward line signifies a DEcrease in poverty. NOW, look up the year starting point of Johnson's War on Poverty and Clinton's administration. If the lines goes DOWN to the LEFT of those dates, it signifies a DEcrease in poverty.
NOW...provide me with a chart that would show poverty if those programs never existed??? I know pea brain right wingers can't assimilate those 'concepts'
AS I stated and you ignored like the good little lemming that you are.... The poverty rate was declining from 22% down to 15% when Johnson's 'war' began. SINCE that time, (note, not cherry picking like you) the poverty rate has gone up and down in a RANGE based on ECONOMIC conditions. Not on anything done in Johnsons 'war'.
Or do you really think that the plunging poverty rate PRIOR to Johnson's 'war' was somehow due Johnson? Or is it more realistic to state that the decline continued on the track it was already on until the next recession?
I also can't help but notice in your cherry picking of times when the poverty rate declined, you forgot to mention Reagan. I wonder why?
I also can't help but notice that you ALSO IGNORE the FACT that the poverty rate today is where it was when the 'war' began. Why is that moron? Could it be because you are scared to face the FACT that the 'war' did nothing to address poverty? That, as critics of Johnson's 'war' stated long ago, that it is economic growth NOT government interference that determines the poverty rate?
Why is the poverty rate rising under Obama? I wonder?
More stupidity from you. It is impossible to show you 'what might have been'. You fucking idiot.


Nice BFGED burnJohnson first introduced the concept of the War on Poverty in '64 and some legislation was passed in late '64 and '65. According to the chart posted we are at the same poverty rate today as we were in '65 and '66 when the programs would have started to take effect.
And regarding Bill Clinton didn't some people predict his Welfare Reform Act would send thousands or millions of people back into poverty or onto the street?
Thanks for the PROOF...
During the Shriver years more Americans got out of poverty than during any similar time in our history. (The Clinton years - employing the same philosophy - were the second best.)
There is an interesting correlation here. Poverty rates started to rise right at the end of Carter's term through Reagans first term, probably due to a recession. Then it drops down until Bush Sr takes office. The Clinton years are consistently decreasing while the Bush Jr years do the opposite.
Moral of the story: Americans against poverty oppose candidates named Bush.
Thats about what this chart is worth.
Poverty statistics were never kept prior to 1960. But, I am sure what the chart reflects prior to Johnson's BRIEF War on Poverty is due of a strong economy bolstered by the New Deal.
The War on Poverty was a HUGE success, and conservatives have tried ever since to say it wasn't...because they have their own 'remedy'...the liberal era ended with the Great Society brought on by assassinations, the Vietnam War and a splintered Democratic Party, just as John Kenneth Galbraith warned JFK, who was going to withdraw by 1965.
Liberals boarded Bobby Kennedy's funeral train never to be seen again, and the splintering handed Nixon the 1968 election...
THEN, conservatives could address poverty THEIR way.
BFGED please explain how being at the same % now as when the war started is a huge reduction.
P.S. nice changing the topic after SF burned your ass on not being able to read a chart.
Is Johnson still president? Is Sargent Shriver still running the Office of Economic Opportunity?
So YOU can provide me with a chart that shows what poverty would have looked like without those programs...I guess THAT is what a college education can do...
Take a closer look... recession of 80/81, recession of 90/91, recession of 2000-2002, recession of 2008-present.....
Poverty is a direct result (obviously) of economic growth or lack thereof. THAT is what the chart shows.