Ah- I'm glad to see you showing some respect for NASA, maggot.
He didn't Neither do they deserve a whole lot of it these days.
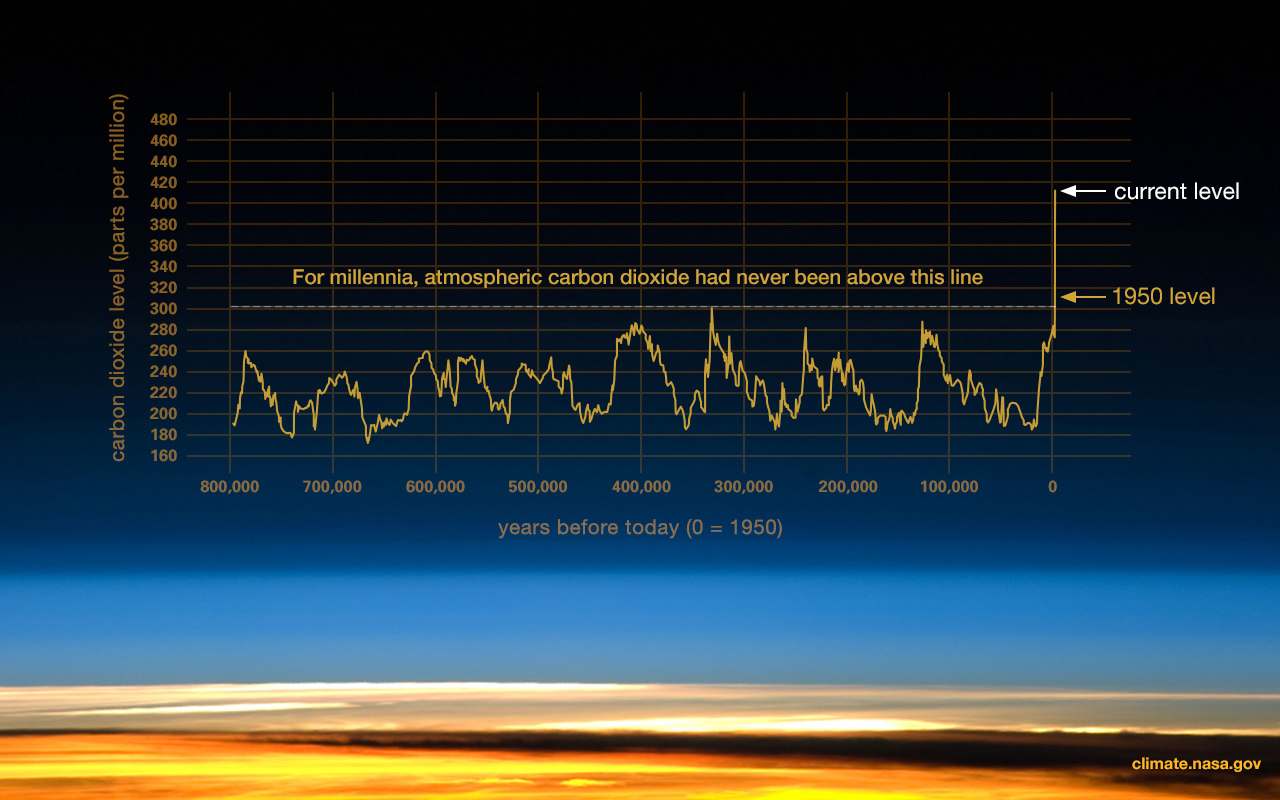
Here is some evidence gleaned by NASA which aims to put you and your Denier Choir where you belong- jail.
Discarding random numbers published by NASA is not a criminal offense.
Ocean Acidification
Since the beginning of the Industrial Revolution, the acidity of surface ocean waters has increased by about 30 percent[/QUOTE]
Ocean water is alkaline, not acid.
This increase is the result of humans emitting more carbon dioxide into the atmosphere and hence more being absorbed into the oceans.
CO2 dissolved in water is simply CO2 dissolved in water. Only about 1% of it becomes carbonic acid. This is a weak acid, completely neutralized by the buffering effects of ocean water.
The amount of carbon dioxide absorbed by the upper layer of the oceans is increasing by about 2 billion tons per year.
If you use the manufactured data out of Mauna Loa observatory, CO2 has increased from 0.0408% of the atmosphere to 0.0410% of the atmosphere for a total difference of 0.0002% of the atmosphere.
Since the entire atmosphere weighs approximately 1.135×10^19 lbs, this means that the weight of CO2 increase in the atmosphere is only about 2.227 * 10^10^15 lbs or 1135 billion tons from all sources. It is unknown how much of that is attributable to Man's activities since that is not possible to measure, so at the least your '2 billion tons per year' is a random number of type randU, making your statement an argument of randU fallacy.
The EPA uses a figure of about 23 billion tons per year, so let's use that random number instead of yours since it's larger.
The percentage of CO2 dissolved in ocean water effectively tracks that of the air, so if we use the EPA random number, then the oceans have dissolved an additional 23 billion tons per year. About 1% of that becomes carbonic acid (a reaction that runs in both directions, but reaches equilibrium at about this point). This puts 0.23 billion tons of carbonic acid in the water.
The oceans weigh approximately 1.450 * 10^18 tons. Thus, the carbonic acid added to the water is approximately 0.0000015% of the ocean water. Ocean water pH varies somewhat, but is typically around 8.2. This is alkaline. It is not possible to acidify an alkaline, so no acidification is occurring. pH is a logarithmic scale, and does not follow a percentage, so your '30 percent' is also an argument from randU fallacy. Effectively, this small amount of weak carbonic acid in ocean water makes no significant effect on the typical pH found in ocean water. This effect is known as 'buffering' and is a fundamental part of any acid/base chemistry.
In other words, you are full of it, and so is NASA. An argument from randU is a fallacy, whether you make it yourself or whether NASA makes it for you. It is the same.
Since you are using this source to make this argument, I will have to call you out on a False Authority fallacy as well.