https://www.ncdc.noaa.gov/sotc/global/201704What is phrenology's mental state from this this?
Migram combs through all the denial science he can to unearth anything nonsupportive of climate science while bypassing 4000 articles per day that support the mainstream opinion. That's my take, and why he should be disregarded.
His ego is now aligned with his position and he is incapable of honesty.

You are using an out of date browser. It may not display this or other websites correctly.
You should upgrade or use an alternative browser.
You should upgrade or use an alternative browser.
Global Temperatures Drop Back To Pre-El Nino Levels
- Thread starter cancel2 2022
- Start date
Nomad
Every trumper is a N4T.
Funny how the usual suspects were shouting from the rooftops about the hottest ever temperatures last year at the height of the strongest El Nino for nearly twenty years. Yet now nothing, nada, zip.
Lowest global temperature anomaly in last 2 years (since July 2015)
The Version 6.0 global average lower tropospheric temperature (LT) anomaly for June 2017 was +0.21 deg. C, down from the May 2017 value of +0.44 deg. C (click for full-size version).
Global area-averaged lower tropospheric temperature anomalies (departures from 30-year calendar monthly means, 1981-2010). The 13-month centered average is meant to give an indication of the lower frequency variations in the data; the choice of 13 months is somewhat arbitrary… an odd number of months allows centered plotting on months with no time lag between the two plotted time series. The inclusion of two of the same calendar months on the ends of the 13-month averaging period causes no issues with interpretation because the seasonal temperature cycle has been removed as has the distinction between calendar months.
The global, hemispheric, and tropical LT anomalies from the 30-year (1981-2010) average for the last 18 months are:
YEAR MO GLOBE NHEM. SHEM. TROPICS
2016 01 +0.55 +0.73 +0.38 +0.84
2016 02 +0.86 +1.19 +0.52 +0.99
2016 03 +0.76 +0.99 +0.54 +1.10
2016 04 +0.72 +0.86 +0.58 +0.93
2016 05 +0.53 +0.61 +0.45 +0.71
2016 06 +0.32 +0.47 +0.17 +0.38
2016 07 +0.37 +0.43 +0.30 +0.48
2016 08 +0.43 +0.53 +0.32 +0.50
2016 09 +0.45 +0.50 +0.39 +0.38
2016 10 +0.42 +0.42 +0.41 +0.46
2016 11 +0.46 +0.43 +0.49 +0.36
2016 12 +0.26 +0.26 +0.27 +0.23
2017 01 +0.33 +0.32 +0.33 +0.09
2017 02 +0.39 +0.58 +0.19 +0.07
2017 03 +0.23 +0.37 +0.09 +0.06
2017 04 +0.27 +0.29 +0.26 +0.22
2017 05 +0.44 +0.39 +0.49 +0.41
2017 06 +0.21 +0.32 +0.09 +0.39
NOTE: We have added the Metop-B satellite to the processing stream, with data since mid-2013. The Metop-B satellite has its orbit actively maintained, so the AMSU data from it does not require corrections from orbit decay or diurnal drift. As a result of adding this satellite, most of the monthly anomalies since mid-2013 have changed, by typically a few hundredths of a degree C. The 1979-2017 linear trend remains at +0.12 C/decade.

Hey Einstoner... first: look up the definition of the word ANOMALY.
Second: note that every temperature listed is in the + direction. That means that the average global temperature at every latitude is still GOING UP.
Ergo, your article which seizes upon a temperature ANOMALY, actually says NOTHING NEW.
But congratulations to you and the rest of the JPP droolers on once again being a bunch of giant tools.
Sea levels continue to rise also, up from about 2.3 to 3.3 millimeters per year. over the last 20 years. Won't affect me at 1000ft but many people in the eastern lowlands and all those vacation homes on sticks in the sand will have problems in about 40 -60 years.
GazzaQueen
Verified User
Sea levels remain stable on the island.
Canceled.2018.1
Canceled
Here is a suggestion. All climate hysterics should seize reproducing immediately. Give it a generation or two, and we can't once again breath easy.
Bigdog
Harris - make America a 3rd world shithole
Sea levels continue to rise also, up from about 2.3 to 3.3 millimeters per year. over the last 20 years. Won't affect me at 1000ft but many people in the eastern lowlands and all those vacation homes on sticks in the sand will have problems in about 40 -60 years.
All those wealthy elite with beach front hotels

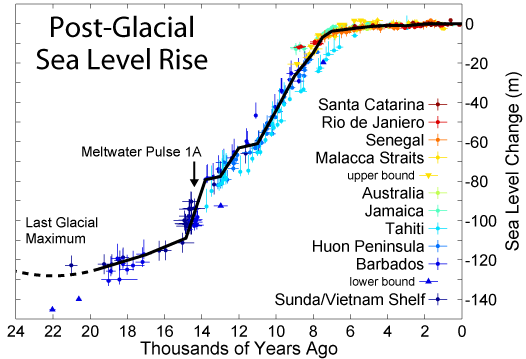
Between 15,000 years ago and 8,000 years ago, the sea level rose about 360 feet. That's a period of about 70 centuries in which the sea level rose about 5 feet every 100 years.
Those damn cave men with their lawn mowers and bbq grills
Sea levels continue to rise also, up from about 2.3 to 3.3 millimeters per year. over the last 20 years. Won't affect me at 1000ft but many people in the eastern lowlands and all those vacation homes on sticks in the sand will have problems in about 40 -60 years.
According to Al Gore we all should have been underwater by 100's of feet already. That being said, you are not very good at math are you? And, ever wonder why those homes are on pilings there genius? It is better in your case to keep quiet and let people think you are stupid than to open your uneducated mouth and confirm the fact.
cancel2 2022
Canceled
So you think that you know more than Dr. Roy Spencer who maintains the UAH dataset at the University of Alabama? For the umpteenth fucking time, we know the temperature has gone up but far far less than predicted by climate models and they have now gone back below the temperatures at the El Nino peak. That is simple enough to follow surely, if you can't then go boil your head.Hey Einstoner... first: look up the definition of the word ANOMALY.
Second: note that every temperature listed is in the + direction. That means that the average global temperature at every latitude is still GOING UP.
Ergo, your article which seizes upon a temperature ANOMALY, actually says NOTHING NEW.
But congratulations to you and the rest of the JPP droolers on once again being a bunch of giant tools.
Sent from my iPhone 25S with cherries on top
Buckly J. Ewer
Racism Whistleblower
Palm Springs hits new record high temperature as Southern California broils
http://www.latimes.com/local/lanow/...uthern-california-records-20170707-story.html
Friday temperatures break record high for date, heat warning continues
https://www.reviewjournal.com/weath...-record-high-for-date-heat-warning-continues/
Heat Wave Snaps 131-Year-Old Los Angeles Temperature Record
http://www.hollywoodreporter.com/ne...ar-old-los-angeles-temperature-record-1019548

Poor Tom
http://www.latimes.com/local/lanow/...uthern-california-records-20170707-story.html
Friday temperatures break record high for date, heat warning continues
https://www.reviewjournal.com/weath...-record-high-for-date-heat-warning-continues/
Heat Wave Snaps 131-Year-Old Los Angeles Temperature Record
http://www.hollywoodreporter.com/ne...ar-old-los-angeles-temperature-record-1019548
Poor Tom
GazzaQueen
Verified User
We did a job at a private airport in Palm Springs one time and it was so hot the asphalt on the runway got soft. The crew was making footprints on it.
Buckly J. Ewer
Racism Whistleblower
We did a job at a private airport in Palm Springs one time and it was so hot the asphalt on the runway got soft. The crew was making footprints on it.
Poor Tom
What is phrenology's mental state from this this?
Migram combs through all the denial science he can to unearth anything nonsupportive of climate science while bypassing 4000 articles per day that support the mainstream opinion. That's my take, and why he should be disregarded.
His ego is now aligned with his position and he is incapable of honesty.
What's a pseudo science head bump-reading person got to do with this?
GazzaQueen
Verified User
Bigdog
Harris - make America a 3rd world shithole
Palm Springs hits new record high temperature as Southern California broils
http://www.latimes.com/local/lanow/...uthern-california-records-20170707-story.html
Friday temperatures break record high for date, heat warning continues
https://www.reviewjournal.com/weath...-record-high-for-date-heat-warning-continues/
Heat Wave Snaps 131-Year-Old Los Angeles Temperature Record
http://www.hollywoodreporter.com/ne...ar-old-los-angeles-temperature-record-1019548
Poor Tom
That is weather not climate, jackass. Liberals are so fucking stupid when it comes to sciencey stuff
Buckly J. Ewer
Racism Whistleblower
I'm rich.
You're mad.
")
You are a white racist republican dude... Posing as a black woman... and everyone here knows it...
I am laughing at you, dude.
GazzaQueen
Verified User
You are a white racist republican dude... Posing as a black woman... and everyone here knows it...
I am laughing at you, dude.
I married a poor white hippie. We done good.
You're #3. Try harder.
Bigdog
Harris - make America a 3rd world shithole
You are a white racist republican dude... Posing as a black woman... and everyone here knows it...
I am laughing at you, dude.
Why do you care what color skin a person has?
Are you a racist?
That's a rhetorical question, ... I already know you are
Buckly J. Ewer
Racism Whistleblower
That is weather not climate, jackass. Liberals are so fucking stupid when it comes to sciencey stuff
Science tells us the "weather" has never been this hot before, cock sucker...
Poor Tom
Last edited:
Bigdog
Harris - make America a 3rd world shithole
Science tells us he "weather" has never been this hot before, cock sucker...
Poor Tom
Good Gawd, you really do not know the difference between weather and climate
God has such a wonderful sense of humor. He's "confounding the wise with their foolishness" again.
So true. I would call it "the arrogant" over "the wise". There's nothing "wise" about liberal memes.