that wouldn't necessarily prevent the popular vote winners from not getting as many seats. said lines are still just as arbitrary, they just lack intention.
Without some sort of specific intention to gerrymander one way or the other, the bias one way or the other is generally going to be roughly random. And, on the whole, the randomness one way or the other in each district will usually more or less cancel itself out on the whole, only really mattering in very tight elections, and significant deviations will generally be incredibly unlikely. It's sort of like flipping a coin 435 times and averaging the results; it's extraordinarily unlikely that you're going to get a result that deviates significantly from 0.5.
With house districts, sometimes local factors come into play, but it's extremely unlikely that the Republicans just happened to get a shitload of excellent candidates running in tight districts while the Democrats got no such luck, or that the Democrats ran a bunch of extremely good candidates in otherwise safely Democratic seats while the Republicans rarely did so. No, local factors such as the quality of candidates in key districts are essentially random on an overall level as well, and shouldn't show some sort of general bias towards one party or the other.
In general, a good model of how many seats a party should win, given the swing in the national popular vote from one party to another, is to simply take the results in each district, apply the same swing to them, and tally who wins and loses given that. Of course, this model often doesn't predict which seats will actually change hands very well, because, again, that's often due to local factors, but it does predict the overall number of seats for each party with a high degree of accuracy, because, again, local factors are mostly random, and cancel themselves out on the grand scale of things.
So, taking 2010:
R: 51.4% - 55.6% seats
D: 44.8% - 44.4% seats
Margin: 6.6% R - 11.2% R
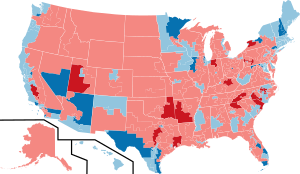
And 2011:
R: 48.5% vote - 54.6% seats
D: 48.8% vote - 45.3% seats
Margin: 0.3% D - 9.3% R
Swing: 6.9% D - 1.9% D
It is naive to assume that this is due to random local factors being very unlucky for Democrats, or the random drawing of largely unintentionally biased districts randomly happening to favor Republicans. Since we know there are different districts in one election than the other, we can largely just attribute it to the bias in the districts - roughly 5% more biased towards the Republicans than the old ones. So, the Democrats would need to win a substantial majority to even break even with the Republicans, given the current state of the districts.