Rank State Amount
United States….. 650,629,485 United States….. 2,199.11
1 California….. 98,434,685 1 Vermont….. 3,600.16
2 New York….. 51,326,444 2 Hawaii….. 3,477.93
3 Florida….. 33,894,971 3 Wyoming….. 3,417.77
4 Texas….. 32,784,942 4 Connecticut….. 3,300.49
5 Pennsylvania….. 27,262,969 5 Minnesota….. 3,093.93
6 Illinois….. 26,411,689 6 Delaware….. 3,068.98
7 New Jersey….. 24,247,648 7 Massachusetts….. 2,818.39
8 Ohio….. 24,011,238 8 Alaska….. 2,798.66
9 Michigan….. 23,525,187 9 New Jersey….. 2,781.33
10 North Carolina….. 18,639,618 10 California….. 2,724.31
11 Massachusetts….. 18,034,862 11 New York….. 2,665.62
12 Virginia….. 15,918,847 12 Rhode Island….. 2,443.07
13 Minnesota….. 15,881,131 13 Maine….. 2,432.35
14 Georgia….. 15,665,563 14 Maryland….. 2,386.95
15 Washington….. 14,839,634 15 Wisconsin….. 2,375.77
16 Maryland….. 13,366,914 16 West Virginia….. 2,367.17
17 Wisconsin….. 13,152,251 17 Washington….. 2,359.99
18 Indiana….. 12,853,976 18 Arkansas….. 2,352.90
19 Connecticut….. 11,584,728 19 Nevada….. 2,347.90
20 Arizona….. 11,008,428 20 Michigan….. 2,324.39
21 Tennessee….. 10,007,292 21 New Mexico….. 2,322.78
22 Missouri….. 9,543,814 22 North Dakota….. 2,202.97
23 Kentucky….. 9,090,882 23 Pennsylvania….. 2,193.32
24 Louisiana….. 8,638,674 24 Kentucky….. 2,178.50
25 Alabama….. 7,774,147 25 Nebraska….. 2,158.36
26 Colorado….. 7,648,456 26 North Carolina….. 2,146.68
27 South Carolina….. 7,318,388 27 Virginia….. 2,103.72
28 Oklahoma….. 6,859,030 28 Ohio….. 2,094.49
29 Arkansas….. 6,538,720 29 Illinois….. 2,069.40
30 Oregon….. 6,522,665 30 Kansas….. 2,053.85
31 Iowa….. 5,778,350 31 Idaho….. 2,053.51
32 Nevada….. 5,670,169 32 Indiana….. 2,049.42
33 Kansas….. 5,637,807 33 Montana….. 2,003.79
34 Mississippi….. 5,432,152 34 Iowa….. 1,948.20
35 Utah….. 4,703,330 35 Oklahoma….. 1,933.21
36 New Mexico….. 4,478,321 36 Louisiana….. 1,909.52
37 Hawaii….. 4,434,356 37 Florida….. 1,905.28
38 West Virginia….. 4,301,156 38 Utah….. 1,904.18
39 Nebraska….. 3,796,551 39 Mississippi….. 1,859.69
40 Maine….. 3,215,570 40 Arizona….. 1,853.58
41 Idaho….. 2,934,459 41 Oregon….. 1,791.45
42 Rhode Island….. 2,628,747 42 Georgia….. 1,726.61
43 Delaware….. 2,590,217 43 South Carolina….. 1,719.95
44 Vermont….. 2,242,902 44 Alabama….. 1,705.60
45 New Hampshire….. 2,010,775 45 Tennessee….. 1,678.23
46 Montana….. 1,875,545 46 Missouri….. 1,645.49
47 Alaska….. 1,858,311 47 Colorado….. 1,639.54
48 Wyoming….. 1,739,646 48 New Hampshire….. 1,534.94
49 North Dakota….. 1,403,293 49 Texas….. 1,434.16
50 South Dakota….. 1,110,035 50 South Dakota….. 1,430.46
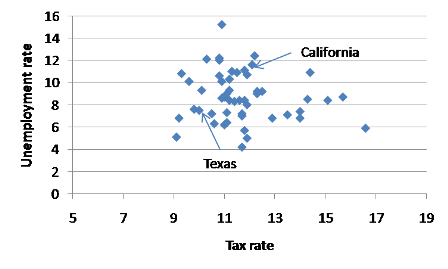
Seems like the states who have higher taxes are doing better than you guys and they have Democratic legislators!!!! How can that possibly be, Tutu?????????????
What is going on here?