
cancel2 2022
Canceled
.
As seen in the accompanying plot, 50-year (1973-2022) summer (June/July/August) temperature trends for the contiguous 48 U.S. states from 36 CMIP-6 climate model experiments average nearly twice the warming rate as observed by the NOAA climate division dataset.
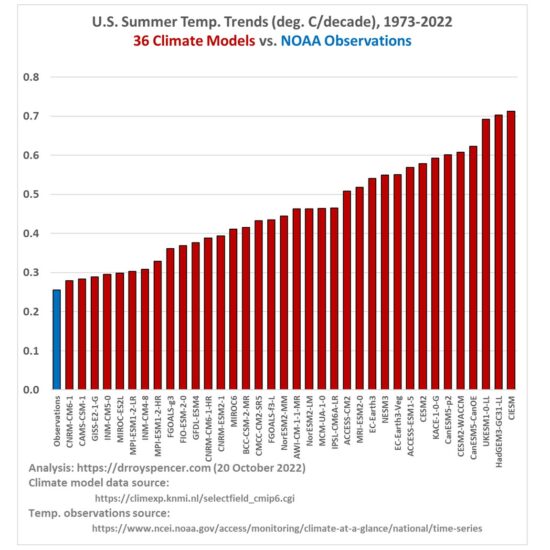
The 36 models are those catalogued at the KNMI Climate Explorer website, using Tas (surface air temperature), one member per model, for the ssp245 radiative forcing scenario. (The website says there are 40 models, but I found that four of the models have double entries). The surface temperature observations come from NOAA/NCEI.
The official NOAA observations produce a 50-year summer temperature trend of +0.26 C/decade for the U.S., while the model trends range from +0.28 to +0.71 C/decade.
As a check on the observations, I took the 18 UTC daily measurements from 497 ASOS and AWOS stations in the Global Hourly Integrated Surface Database (mostly independent from the official homogenized NOAA data) and computed similar trends for each station separately. I then took the median of all reported trends from within each of the 48 states, and did a 48-state area-weighted temperature trend from those 48 median values, after which I also got +0.26 C/decade. (Note that this could be an overestimate if increasing urban heat island effects have spuriously influenced trends over the last 50 years, and I have not made any adjustment for that).
The importance of this finding should be obvious: Given that U.S. energy policy depends upon the predictions from these models, their tendency to produce too much warming (and likely also warming-associated climate change) should be factored into energy policy planning. I doubt that it is, given the climate change exaggerations routinely promoted by environment groups, anti-oil advocates, the media, politicians, and most government agencies.
https://www.drroyspencer.com/wp-con...mperature-trends-ovs-vs-36-CMIP6-models-1.jpg
As seen in the accompanying plot, 50-year (1973-2022) summer (June/July/August) temperature trends for the contiguous 48 U.S. states from 36 CMIP-6 climate model experiments average nearly twice the warming rate as observed by the NOAA climate division dataset.
The 36 models are those catalogued at the KNMI Climate Explorer website, using Tas (surface air temperature), one member per model, for the ssp245 radiative forcing scenario. (The website says there are 40 models, but I found that four of the models have double entries). The surface temperature observations come from NOAA/NCEI.
The official NOAA observations produce a 50-year summer temperature trend of +0.26 C/decade for the U.S., while the model trends range from +0.28 to +0.71 C/decade.
As a check on the observations, I took the 18 UTC daily measurements from 497 ASOS and AWOS stations in the Global Hourly Integrated Surface Database (mostly independent from the official homogenized NOAA data) and computed similar trends for each station separately. I then took the median of all reported trends from within each of the 48 states, and did a 48-state area-weighted temperature trend from those 48 median values, after which I also got +0.26 C/decade. (Note that this could be an overestimate if increasing urban heat island effects have spuriously influenced trends over the last 50 years, and I have not made any adjustment for that).
The importance of this finding should be obvious: Given that U.S. energy policy depends upon the predictions from these models, their tendency to produce too much warming (and likely also warming-associated climate change) should be factored into energy policy planning. I doubt that it is, given the climate change exaggerations routinely promoted by environment groups, anti-oil advocates, the media, politicians, and most government agencies.
https://www.drroyspencer.com/wp-con...mperature-trends-ovs-vs-36-CMIP6-models-1.jpg
Attachments

Last edited:
