Mann-Splaining the Pause?

cancel2 2022

Canceled
An apparent slowing in the rise of global temperatures at the beginning of the twenty-first century, which is not explained by climate models, was referred to as a “hiatus” or a “pause” when first observed several years ago. Climate-change sceptics have used this as evidence that global warming has stopped. But in June last year, a study in Science claimed that the hiatus was just an artefact which vanishes when biases in temperature data are corrected.

Now a prominent group of researchers is countering that claim, arguing in Nature Climate Change that even after correcting these biases the slowdown was real. There is this mismatch between what the climate models are producing and what the observations are showing,” says lead author John Fyfe, a climate modeller at the Canadian Centre for Climate Modelling and Analysis in Victoria, British Columbia. “We can’t ignore it.”

Amazingly, one of the authors of the new paper is Michael Mann of hockey stick fame. Maybe we should say the “pause” has been “Mann-splained”?
Here’s Scientific American on the story yesterday:
.
The disagreement may seem esoteric, but it underpins the biggest climate disagreement of the past decades. Climate models, which are virtual representations of our planet, project that temperatures were much higher in the early 2000s than was the case in reality. Scientists have been trying to understand why.

but remember: everything is settled, shut up, and hand over your car keys. Because we can ignore it, unless you’re the moral equivalent of Holocaust denier.

http://www.powerlineblog.com/archives/2016/02/mann-splaining-the-pause.php
 
An apparent slowing in the rise of global temperatures at the beginning of the twenty-first century, which is not explained by climate models, was referred to as a “hiatus” or a “pause” when first observed several years ago. Climate-change sceptics have used this as evidence that global warming has stopped. But in June last year, a study in Science claimed that the hiatus was just an artefact which vanishes when biases in temperature data are corrected.

Now a prominent group of researchers is countering that claim, arguing in Nature Climate Change that even after correcting these biases the slowdown was real. There is this mismatch between what the climate models are producing and what the observations are showing,” says lead author John Fyfe, a climate modeller at the Canadian Centre for Climate Modelling and Analysis in Victoria, British Columbia. “We can’t ignore it.”

Amazingly, one of the authors of the new paper is Michael Mann of hockey stick fame. Maybe we should say the “pause” has been “Mann-splained”?
Here’s Scientific American on the story yesterday:
.
The disagreement may seem esoteric, but it underpins the biggest climate disagreement of the past decades. Climate models, which are virtual representations of our planet, project that temperatures were much higher in the early 2000s than was the case in reality. Scientists have been trying to understand why.

but remember: everything is settled, shut up, and hand over your car keys. Because we can ignore it, unless you’re the moral equivalent of Holocaust denier.

http://www.powerlineblog.com/archives/2016/02/mann-splaining-the-pause.php

We don't need projection models anymore.
We are at the point where we just need to look around.

201602.gif


Poor Borbo
 
March 2016 Smashes Another Monthly Global Warmth Record

Earth's global temperatures in March 2016 set another monthly record, continuing an almost year-long streak of records shattered, according to three recent independent analyes.

The Japan Meteorological Agency (JMA) calculated the global mean March 2016 temperature was 0.62 degrees Celsius (about 1.1 degrees Fahrenheit) above the March 30-year average from 1981-2010.


Anomaly of global mean March surface temperature from 1891 through 2016, relative to a 1981-2010 base period average, shown by gray line and dots. The blue line denotes a five-year running mean while the red line indicates the long-term March temperature trend. (Japan Meteorological Agency)

Enlarge
March 2016 surface air temperature anomalies, in degrees Celsius, relative to a 1981-2010 average period. (ERA-Interim/Copernicus Climate Change Service)
A second analysis released Friday from NASA's Goddard Institute for Space Studies also concluded March anomalies were the highest in their period of record dating to 1880, a whopping 1.28 degrees Celsius above the 1951-1980 average period.

A few tenths of a degree may not sound overwhelming, but in the world of climate statistics, computed from worldwide temperatures, this is yet another record-shattering figure.

In fact, this warm anomaly doubled the previous record for the month of March in the JMA's database, +0.31 degrees Celsius, set the previous year, 2015.

Similarly, NASA found the March 2016 anomaly crushed the previous March record by over 0.3 degrees.

A third analysis from the Copernicus Climate Change Service (C3S) also found March 2016 to be a record-setter for the month, 0.80 degrees Celsius above the 30-year average, though records date only to 1979.

An analysis from NOAA will be released on April 19.

As has been the case in recent months, the highest temperature anomalies in March were in the highest latitudes of the Northern Hemisphere.

The C3S analysis found temperatures over 6 degrees Celsius (about 10 degrees Fahrenheit) above March averages over much of the Arctic Ocean, Greenland, Barents Sea, Kara Sea, Alaska, northwest Canada, parts of central Asia and Siberia.

Generally above-average March temperatures were seen in the mid-latitudes and tropics both north and south of the equator, with the exceptions of eastern Canada, the North Atlantic Ocean, western Europe, northwest Africa, and central South America.

(MORE: El Niño --> La Niña?)

Much of Antarctica, however, was cooler than average in March, with the exception of the Antarctic Peninsula, Coats Land and Queen Maud Land.

It was a record warm March in Australia, according to the country's Bureau of Meteorology, which was followed by the hottest April day on record in Sydney.

March also topped one of the warmest first three months of the year on record in the United States.

11 Straight Months and Counting...

March 2016 marked the 11th consecutive month global temperatures set records for that particular month in the JMA database.
https://weather.com/news/climate/news/record-warmest-march-global-2016
 
Record Warmth in February
March 17, 2016
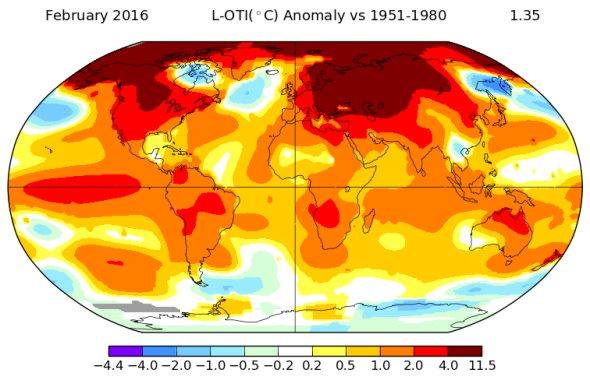
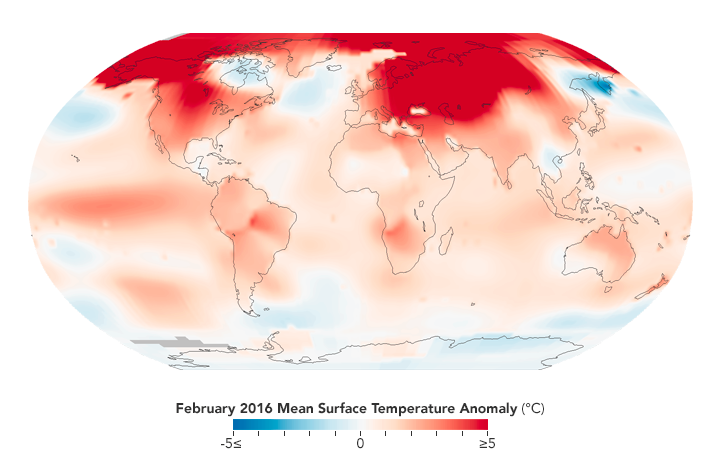
febtemps_gis_2016.png


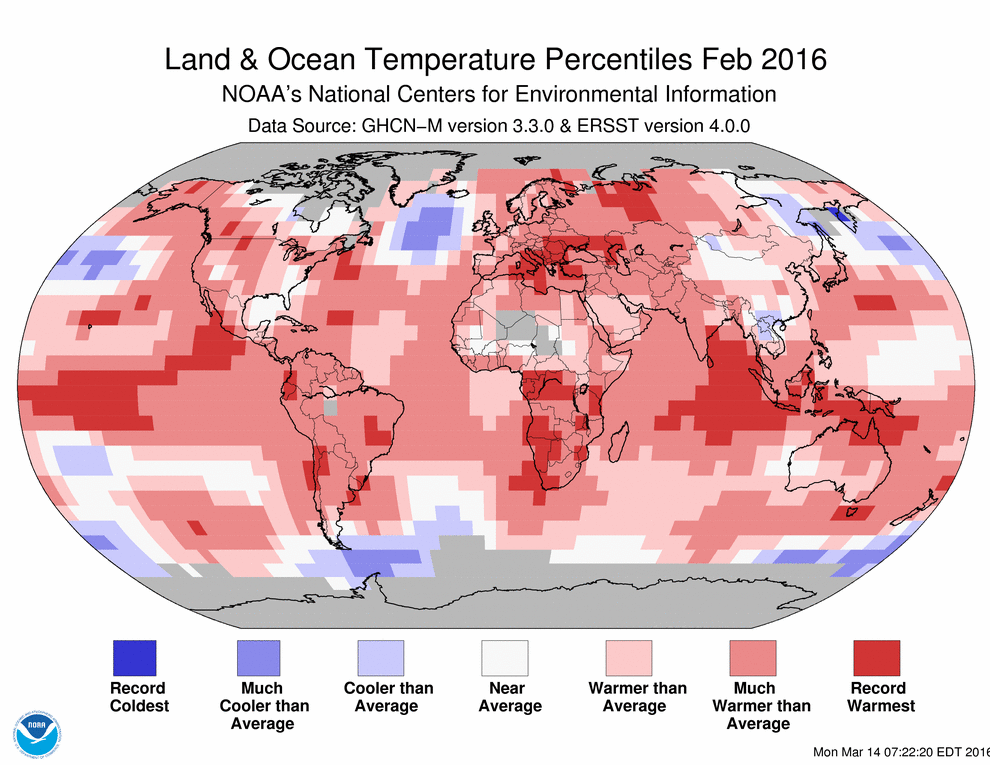
February 2016 was the warmest February in 136 years of modern temperature records. That month deviated more from normal than any month on record.
According to an ongoing temperature analysis conducted by scientists at NASA’s Goddard Institute for Space Studies (GISS), the average global temperature in February was about 0.5 degrees Celsius (0.8 degrees Fahrenheit) warmer than the previous record (February 1998). February 2016 was 1.35 degrees Celsius above the 1951–80 average; February 1998 was 0.88°C above it. Both records were set during strong El Niño events.
The map above depicts global temperature anomalies for February 2016. It does not show absolute temperatures; instead it shows how much warmer or cooler the Earth was compared to a baseline average from 1951 to 1980.
Almost all land surfaces on Earth experienced unusually warm temperatures in February 2016. The warmest temperatures occurred in Asia, North America, and the Arctic. Two of the exceptions were the Kamchatka Peninsula and a small portion of southeast Asia, which saw unusually cool temperatures. Note the clear fingerprint of El Niño in the equatorial Pacific Ocean

http://earthobservatory.nasa.gov/IOTD/view.php?id=87691
 
Our Planet’s Temperature Just Reached a Terrifying Milestone

amaps.png.CROP.promovar-mediumlarge.png


Update, March 12, 2016: Data released Saturday from NASA confim that February 2016 was not only the most unusually warm month ever measured globally, at 1.35 degrees Celsius above the long-term average—it was more than 0.2 degrees Celsius warmer than the previously most unusually warm month ever measured: January 2016.* ("Most unusually warm" is not to be confused with "warmest ever measured." Average temperatures are much more difficult to calculate than deviations from average, for many technical reasons—including the fact that there's a strong seasonality in average global temperatures. Climate scientists also strongly prefer discussing deviations from average because that's what matters to plants, animals, and humans adapting to climate change.) The new NASA data confirms unofficial data released earlier this month showing a dramatic and ongoing surge in the planet's temperature—if anything, that data, upon which the previous versions of this post were based, were an underestimate. On Twitter, Gavin Schmidt, the director of NASA’s Goddard Institute for Space Studies, which maintains the NASA temperature database, noted that February’s temperature record was “special” and commented simply: “Wow.”

NASA’s global temperature data is measured from a 1951-1980 baseline, about 0.3 degrees warmer than pre-industrial levels. That means February 2016 was the first month in history that global average temperatures passed the 1.5 degree Celsius mark. Also, since last month’s warmth was concentrated in the Northern Hemisphere (2.76 degrees Celsius warmer than the 1951-1980 baseline) and the Arctic (5.36 degrees Celsius warmer than the 1951-1980 baseline), these regions of our planet were also record warm, likely the warmest they’ve been for at least thousands of years. As I said in the previous version of this post—even though this surge of warmth is likely only temporary, it is a major milestone moment for humanity and our relationship to our planet.

http://www.slate.com/blogs/future_tense/2016/03/01/february_2016_s_shocking_global_warming_temperature_record.html

Were they growing grapes in England ? Sure you want to stick with that thousands of years bit ?
 
So Leo Troll uses a recurring natural phenomenon as proof of AGW? And let me guess, Leo Troll thinks man causes El Nino.

:rofl2:
 
Poor Leon is terrified....as in extremely frightened......scared stiff.....

Poor poor Leontheterrified

Does he have stock in Algores carbon credit scam or bankrupt solar firm ?

It's over warmers. Wake up c and smell the mocha java.
 
I've got a great idea for a cartoon; but I can't draw a straight line, without a ruler

Remember from Lord of the Rings, when Gandalf stood at the bridge, slammed down his staff, and proclaimed "YOU SHALL NOT PASS"??

OK, now imagine a liberal standing in front of an advancing glacier, holding a copy of the warming "information", and shouting "YOU SHALL NOT PASS!!:. :D

Glaciers move faster whe they are melting Ma'am
 
Glaciers move faster whe they are melting Ma'am

If you only listened to scientific illiterates like Leon Twat then you'd think that all glaciers were melting which is just alarmist bullshit. The Kangerdlugssuaq glacier in Greenland is growing 35 metres per day or over 12 km a year!! That is just one of many around the world!!

glacier-ers2-march-may_h.gif


https://stevengoddard.wordpress.com/2011/07/12/good-grace-greenland-glacier-growing/

http://www.iceagenow.com/List_of_Expanding_Glaciers.htm

You can stop now Borbo. You have lost the argument worldwide.
Poor Borbo
 
Back
Top