
You are using an out of date browser. It may not display this or other websites correctly.
You should upgrade or use an alternative browser.
You should upgrade or use an alternative browser.
Chart(s) of the Day
- Thread starter Bonestorm
- Start date
Thorn
Member
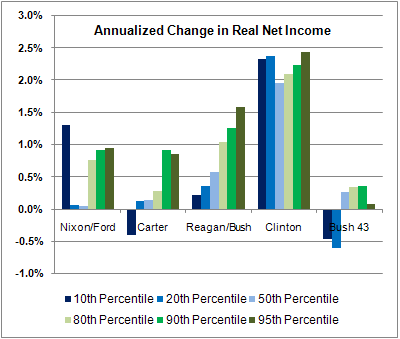
Here's another interesting chart of the changes in real (inflation-adjusted) net household income for various income classes:
I just get a little red X in this one. The first two came out fine.
I just get a little red X in this one. The first two came out fine.
That's odd. I can see it.
Go here:
http://www.fivethirtyeight.com/2009/02/clinton-economic-record-and-rising.html
It's got the chart with some (somewhat lengthy) analysis.
Cancel 2016.2
The Almighty
Interesting not only for the recent steep drop in production relative to capacity but also for the generally slow growth of both production and capacity during the entirety of Bush's term.
You might want to take another look at that chart.... production as a percentage of capacity escalated from 2001 until the end of 2007.
Of course capacity didnt escalate much by itself. After the recession of 2000-2001 we had excess capacity. No need to add capacity until the current is used. According to the chart, cap utilization got back to about pre recession levels.
Obviously it all dropped off a cliff in 2008.
Cancel 2016.2
The Almighty
That's odd. I can see it.
Go here:
http://www.fivethirtyeight.com/2009/02/clinton-economic-record-and-rising.html
It's got the chart with some (somewhat lengthy) analysis.
I'll have to look at the data, but I do question why it is they lump Nixon and Ford together and Reagan and Bush together? Why not show their individual performances. Again, I'll print off the data tomorrow and take a look.
Other than that, I am sure it is supposed to show how the Republican Congress did a great job under Clinton making sure everyone benefited. That was the point you were trying to get across wasnt it?
You might want to take another look at that chart.... production as a percentage of capacity escalated from 2001 until the end of 2007.
Of course capacity didnt escalate much by itself. After the recession of 2000-2001 we had excess capacity. No need to add capacity until the current is used. According to the chart, cap utilization got back to about pre recession levels.
Obviously it all dropped off a cliff in 2008.
1) Yes, production as a percentage of capacity increased (escalated is not the word I would use at all) from 2001 until the end of 2007. We were not in a recession at that time. However, the pace of the increase was anemic at best as compared to pretty much any other non-recession period of similar length dating back to the mid-60s. Hence, "generally slow growth . . ."
2) Again, check out the capacity increase after the 2001 recession as compared to capacity increases after previous recessions. Hence, generally slow growth of capacity and production.
3) On this we agree.
I'll have to look at the data, but I do question why it is they lump Nixon and Ford together and Reagan and Bush together? Why not show their individual performances. Again, I'll print off the data tomorrow and take a look.
Other than that, I am sure it is supposed to show how the Republican Congress did a great job under Clinton making sure everyone benefited. That was the point you were trying to get across wasnt it?
1) I'd advise that you follow the link are read the explanation as to what is shown and what is excluded. For example, transition years are excluded (1993, 2001).
2) Negative, but we can all draw our own conclusions. I mean, at best it is an argument for divided government.
Last edited:
ib1yysguy
Junior Member
comparing the decline to other recessions we may be nearing the bottom soon.
Yeah, you've got a great track record of being right about the economy too.
Cancel 2016.2
The Almighty
1) Yes, production as a percentage of capacity increased (escalated is not the word I would use at all) from 2001 until the end of 2007. We were not in a recession at that time. However, the pace of the increase was anemic at best as compared to pretty much any other non-recession period of similar length dating back to the mid-60s. Hence, "generally slow growth . . ."
2) Again, check out the capacity increase after the 2001 recession as compared to capacity increases after previous recessions. Hence, generally slow growth of capacity and production.
3) On this we agree.
1) So the 8-10 point rise which was seen in every other recovery from a recession (except for the early 90 recession) was anemic?
2) true, the escalation wasnt as steep as previous recoveries, but at the same time the decline was also more prolonged.
Topspin
Verified User
Yeah, you've got a great track record of being right about the economy too.
I'll match my investing performance and net worth against you anyday Ib1 dumbass.
When chappy first camce on board I told him housing needed to be at the long term mean trend of increases not the inflated stuff.
Bring it on tool what do you have to brag about?